
Gerrymandered Traffic Data?
EBLN Monitoring Report: A closer look at the crafty positioning of the traffic sensors

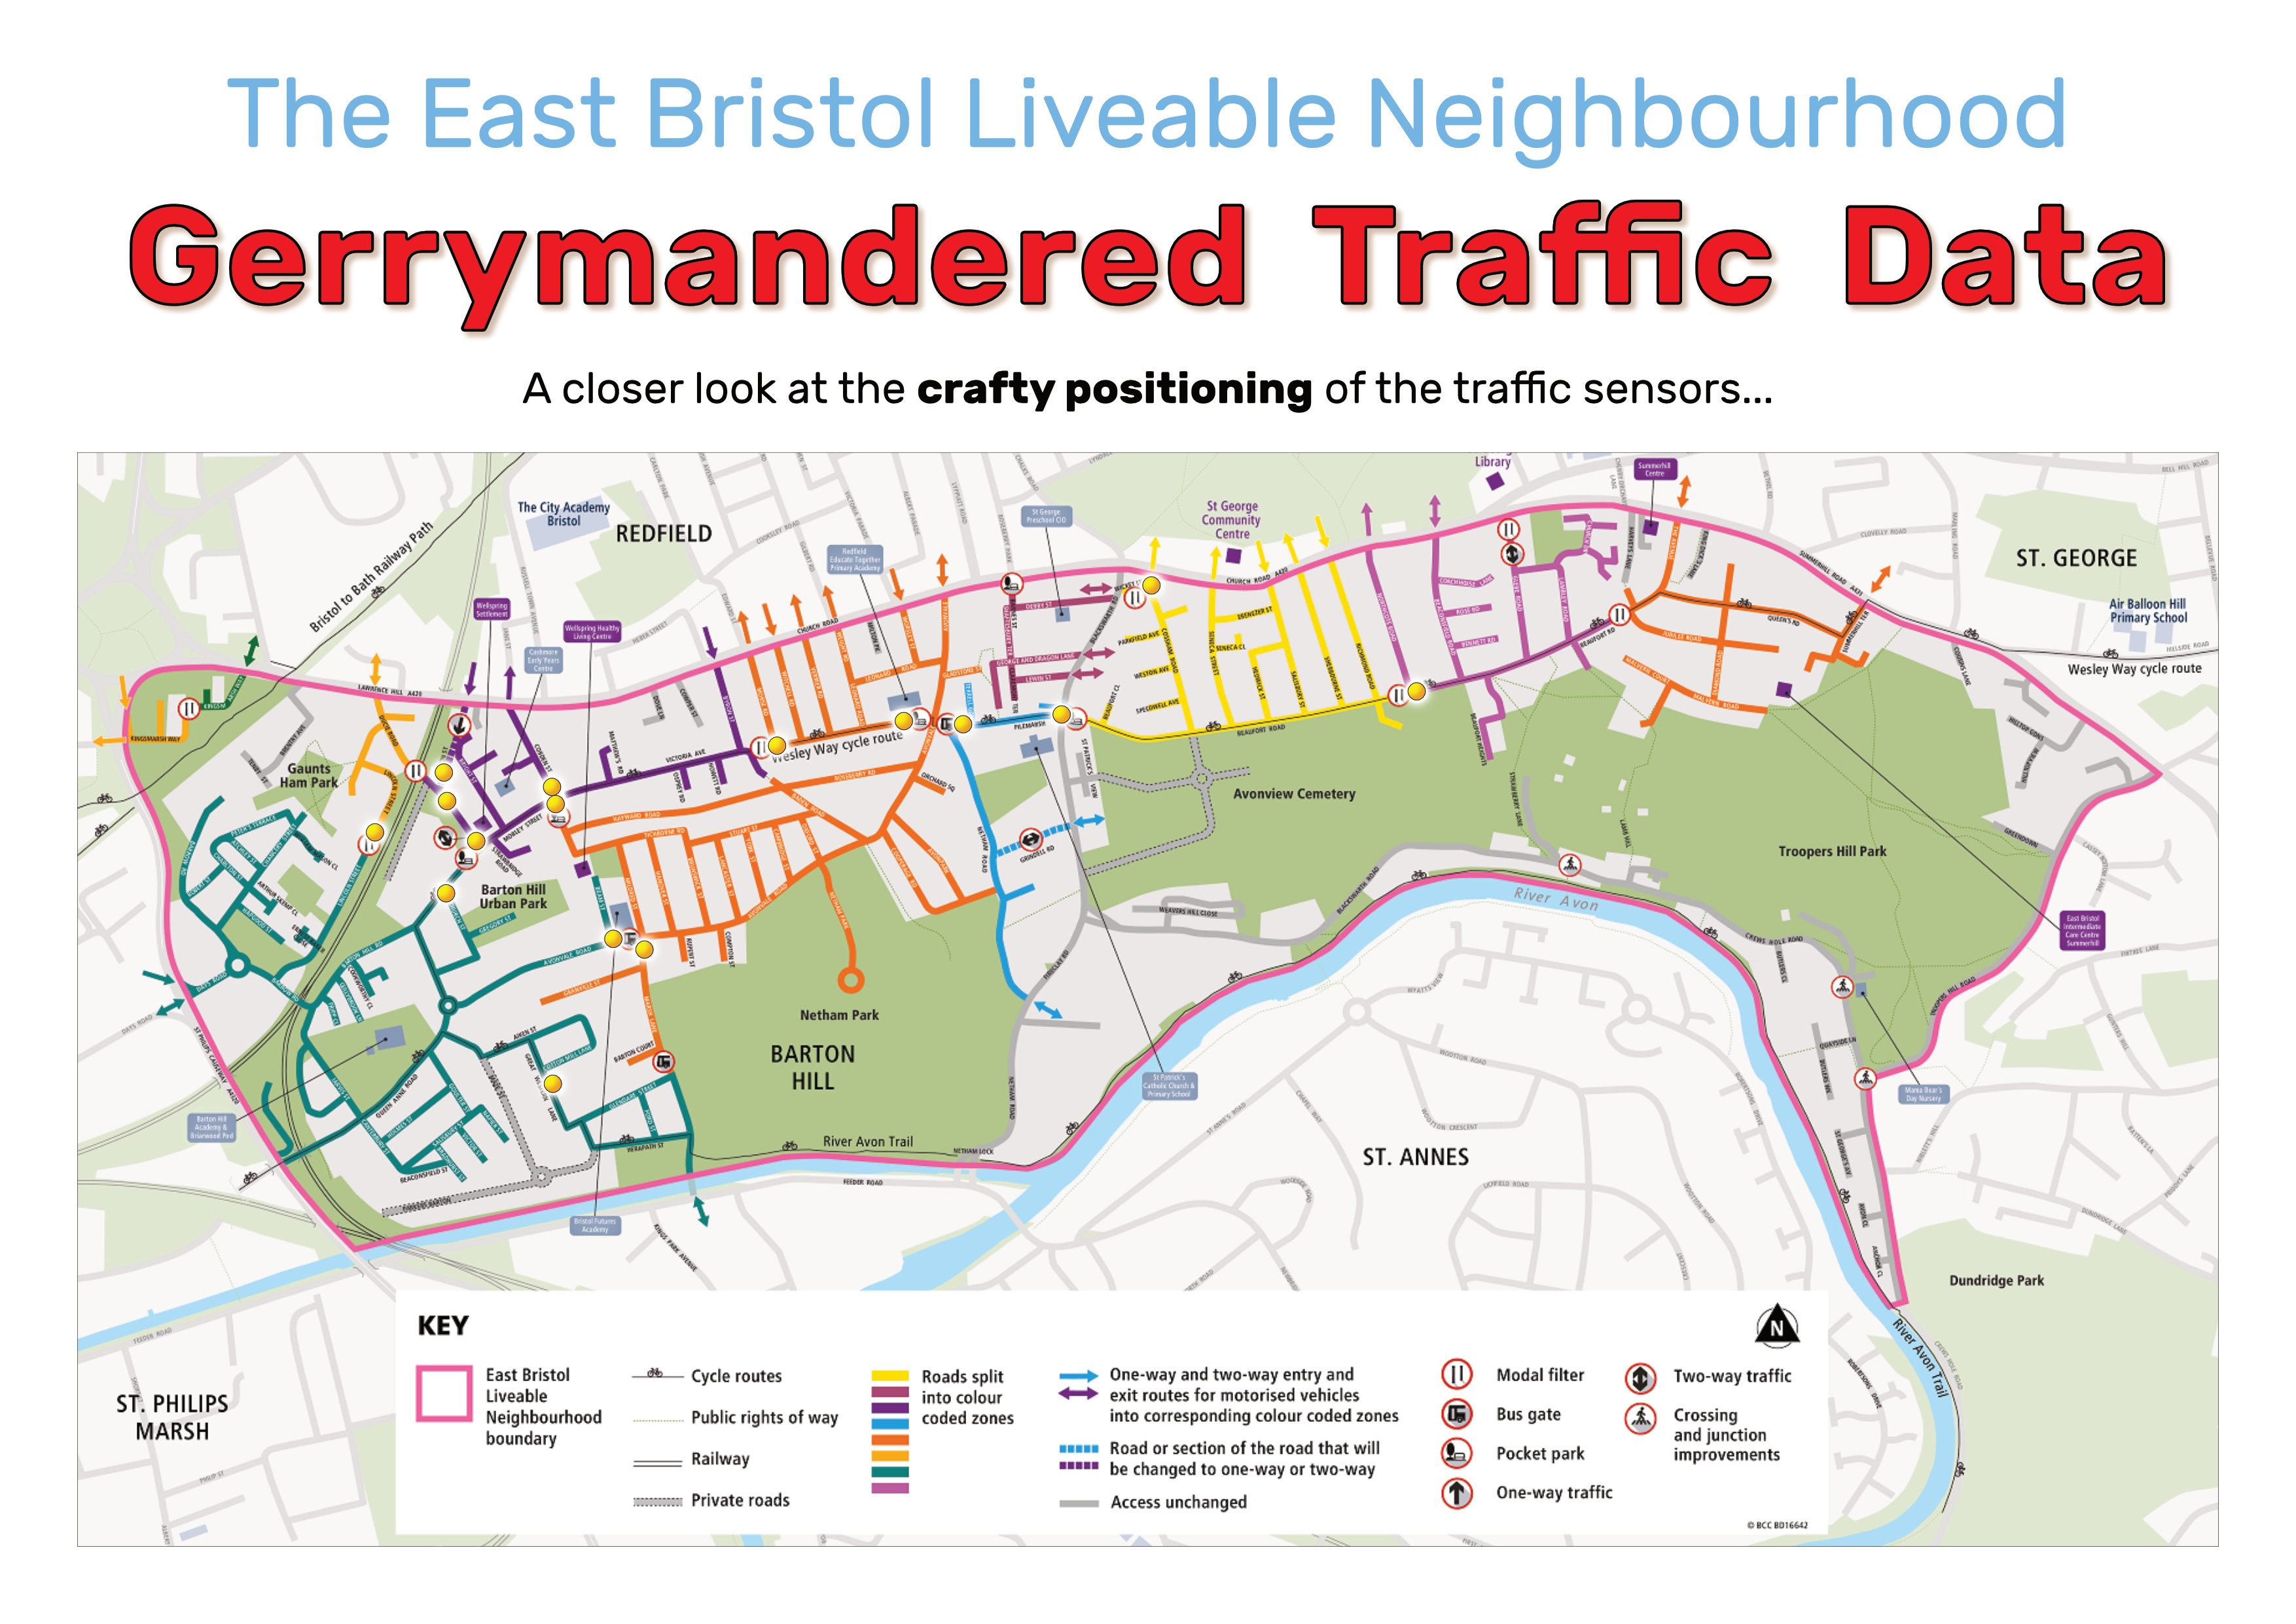
As this Thursday’s Transport & Connectivity Committee East Bristol ‘Liveable Neighbourhood’ vote rapidly approaches, members of the public have been digging into the data presented in the Full Business Case. The facts coming to light in relation to council claims around the achievements of the EBLN road blocks are gravely concerning.
Today we are publishing the first of two highly relevant statements that have been submitted to Thursday’s public forum as well as circulated to all committee members.
Should they go ahead and vote to make these discriminatory mobility restrictions permanent, they will be doing so in full knowledge that the data they are basing their decisions on is grossly biased and misleading.
Please share this post far and wide. Bristolians need to know how underhand their City Council is being, and start to question why…
Over now to local data expert Jesse Zyla, who has detected some breathtakingly audacious use of the traffic sensor positioning used to inform the council’s monitoring report.
The “77% Reduction”
In order to persuade Councillors to approve the permanent installation of the East Bristol Liveable Neighbourhood, the Transport Department has presented a Full Business Case.
Page 25 details the “Trial Scheme Outcomes”.
And when discussing “Overall motorised traffic levels”, a “key headline” is stated as:
“Internal roads saw a 77% reduction on weekdays and 72% on weekends.”
This refers to “before and after” data gathered by VivaCity traffic sensors — in Oct 2024 and Oct 2025 — with the resulting comparisons published in the Monitoring Report.
Page 12 of the Monitoring Report has a map of the VivaCity monitoring sites, and those locations can also be seen here: VivaCity Sensors Locations.
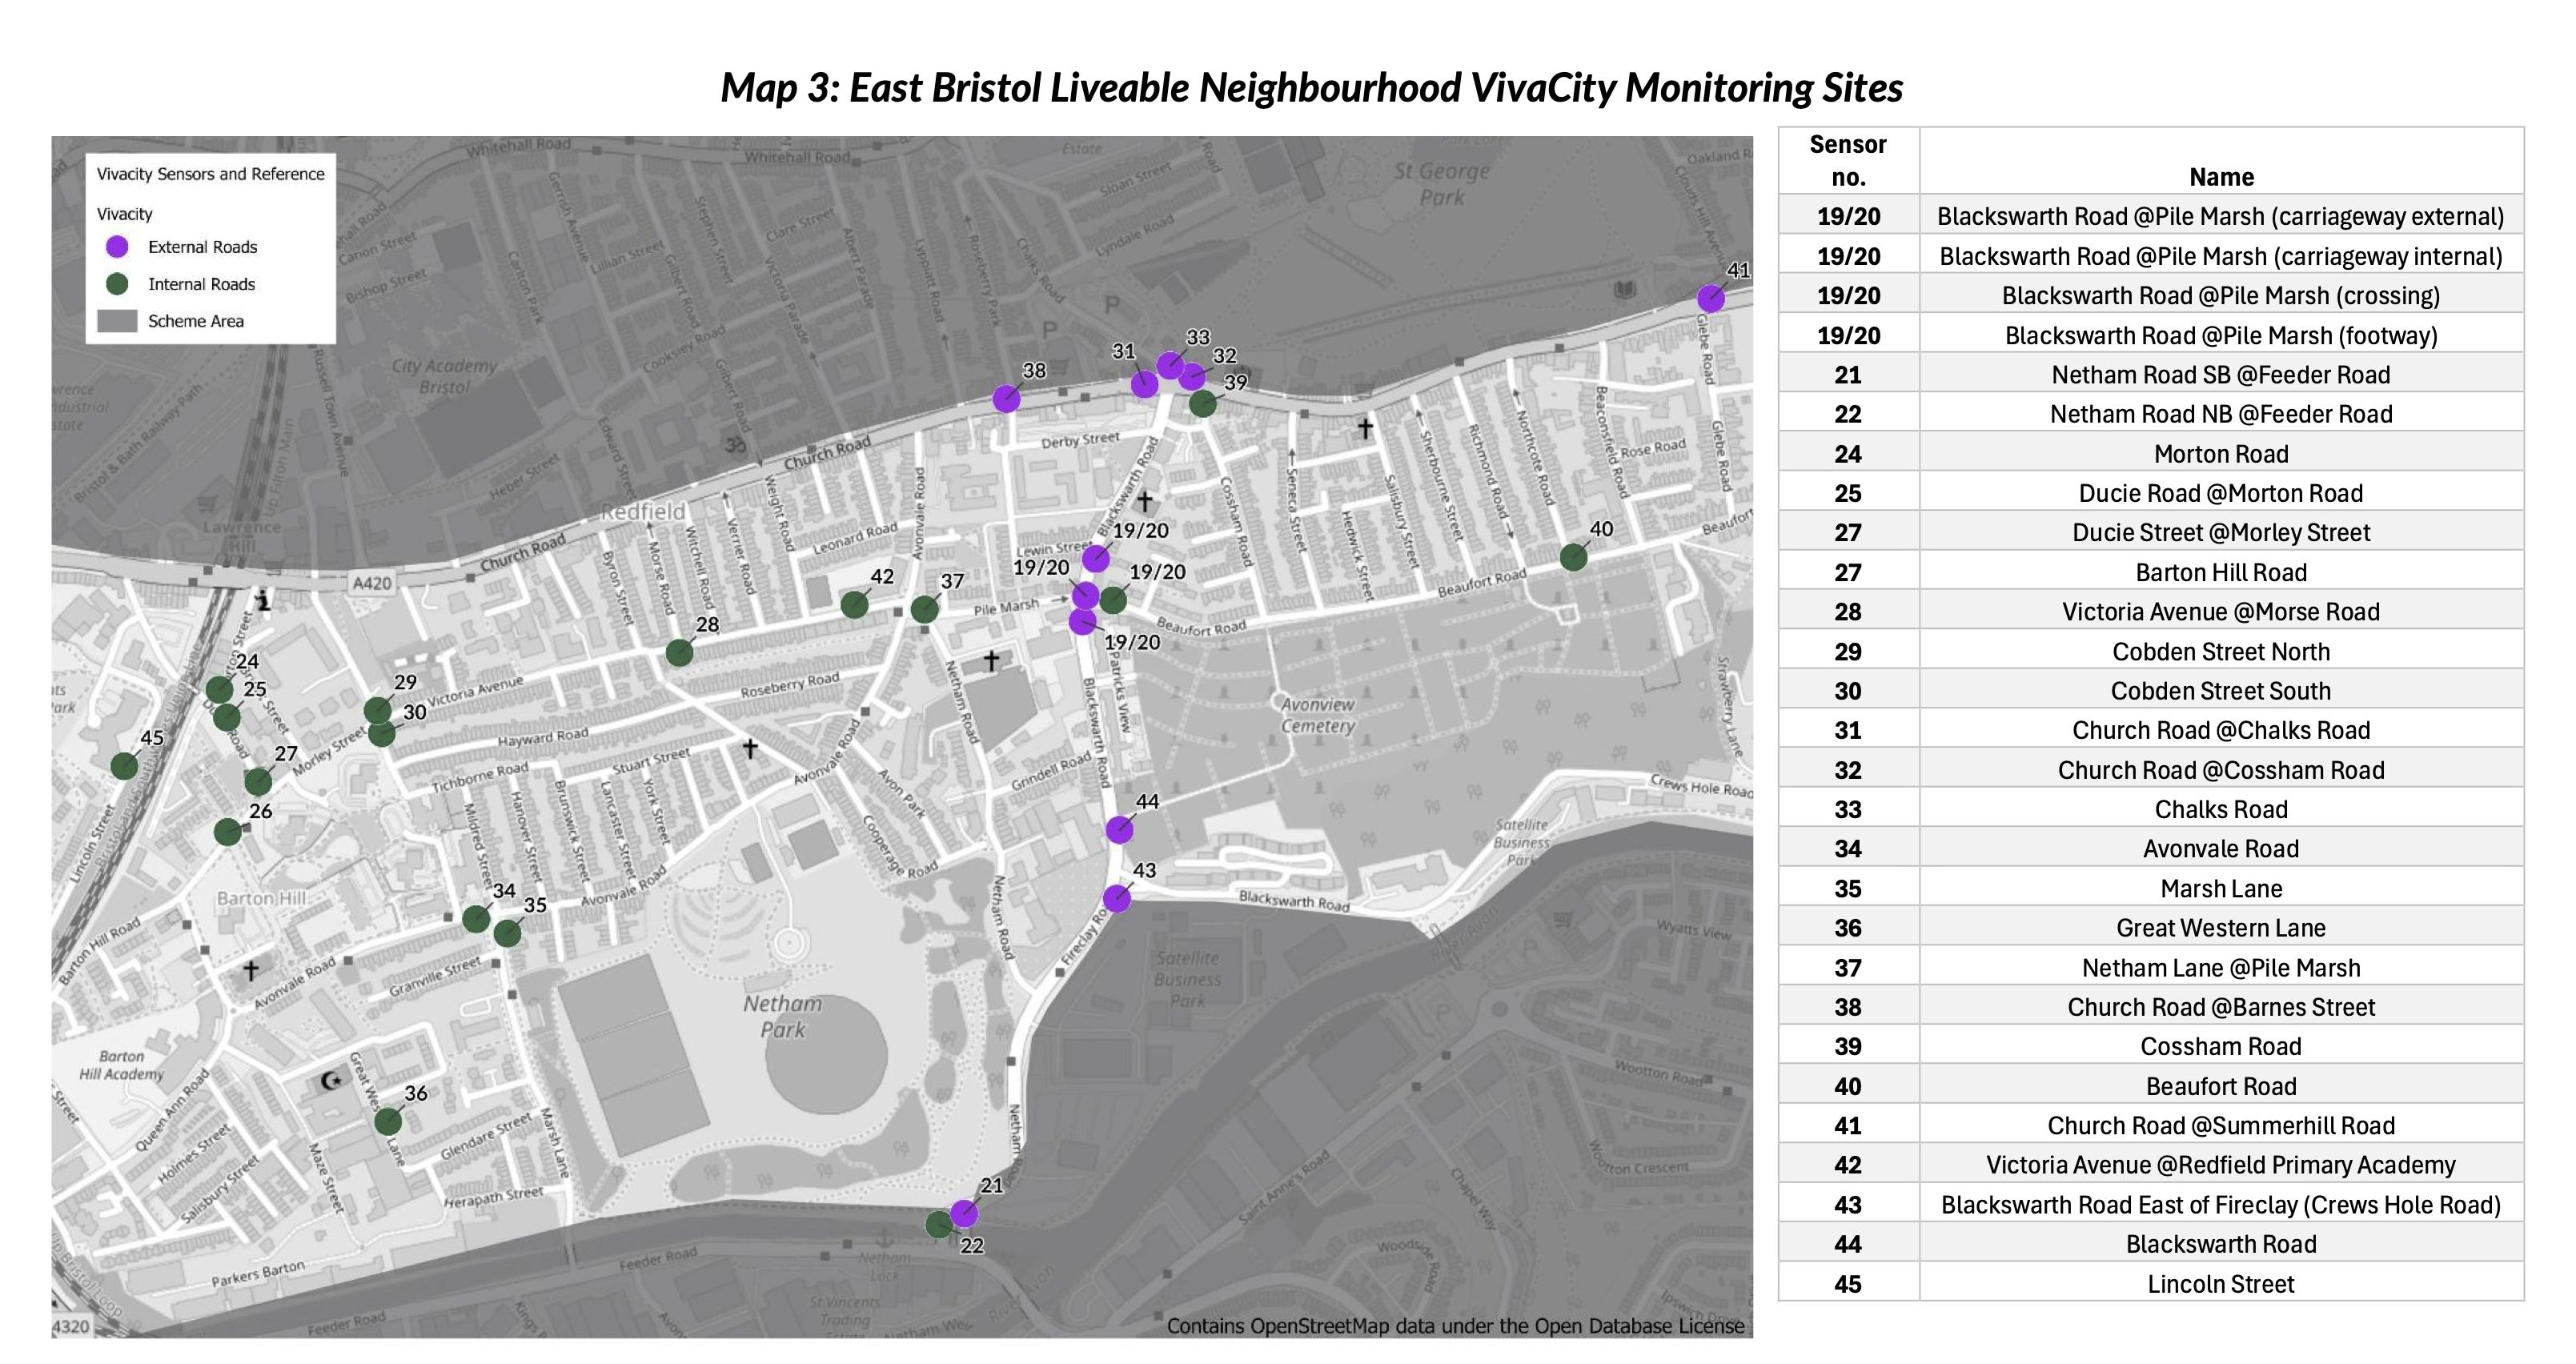
Of the 28 sensors, 16 are deemed to be on INTERNAL (residential) ROADS, while the other 12 are on External (boundary) Roads, like Blackswarth Rd and Church Rd.
Page 23 shows that MOST of these Internal Roads saw a large reduction in Motorised Traffic Volumes.
EXCEPT for Great Western Lane — which saw a 288% INCREASE — due to the Marsh Lane bus gate forcing drivers to use that road instead.
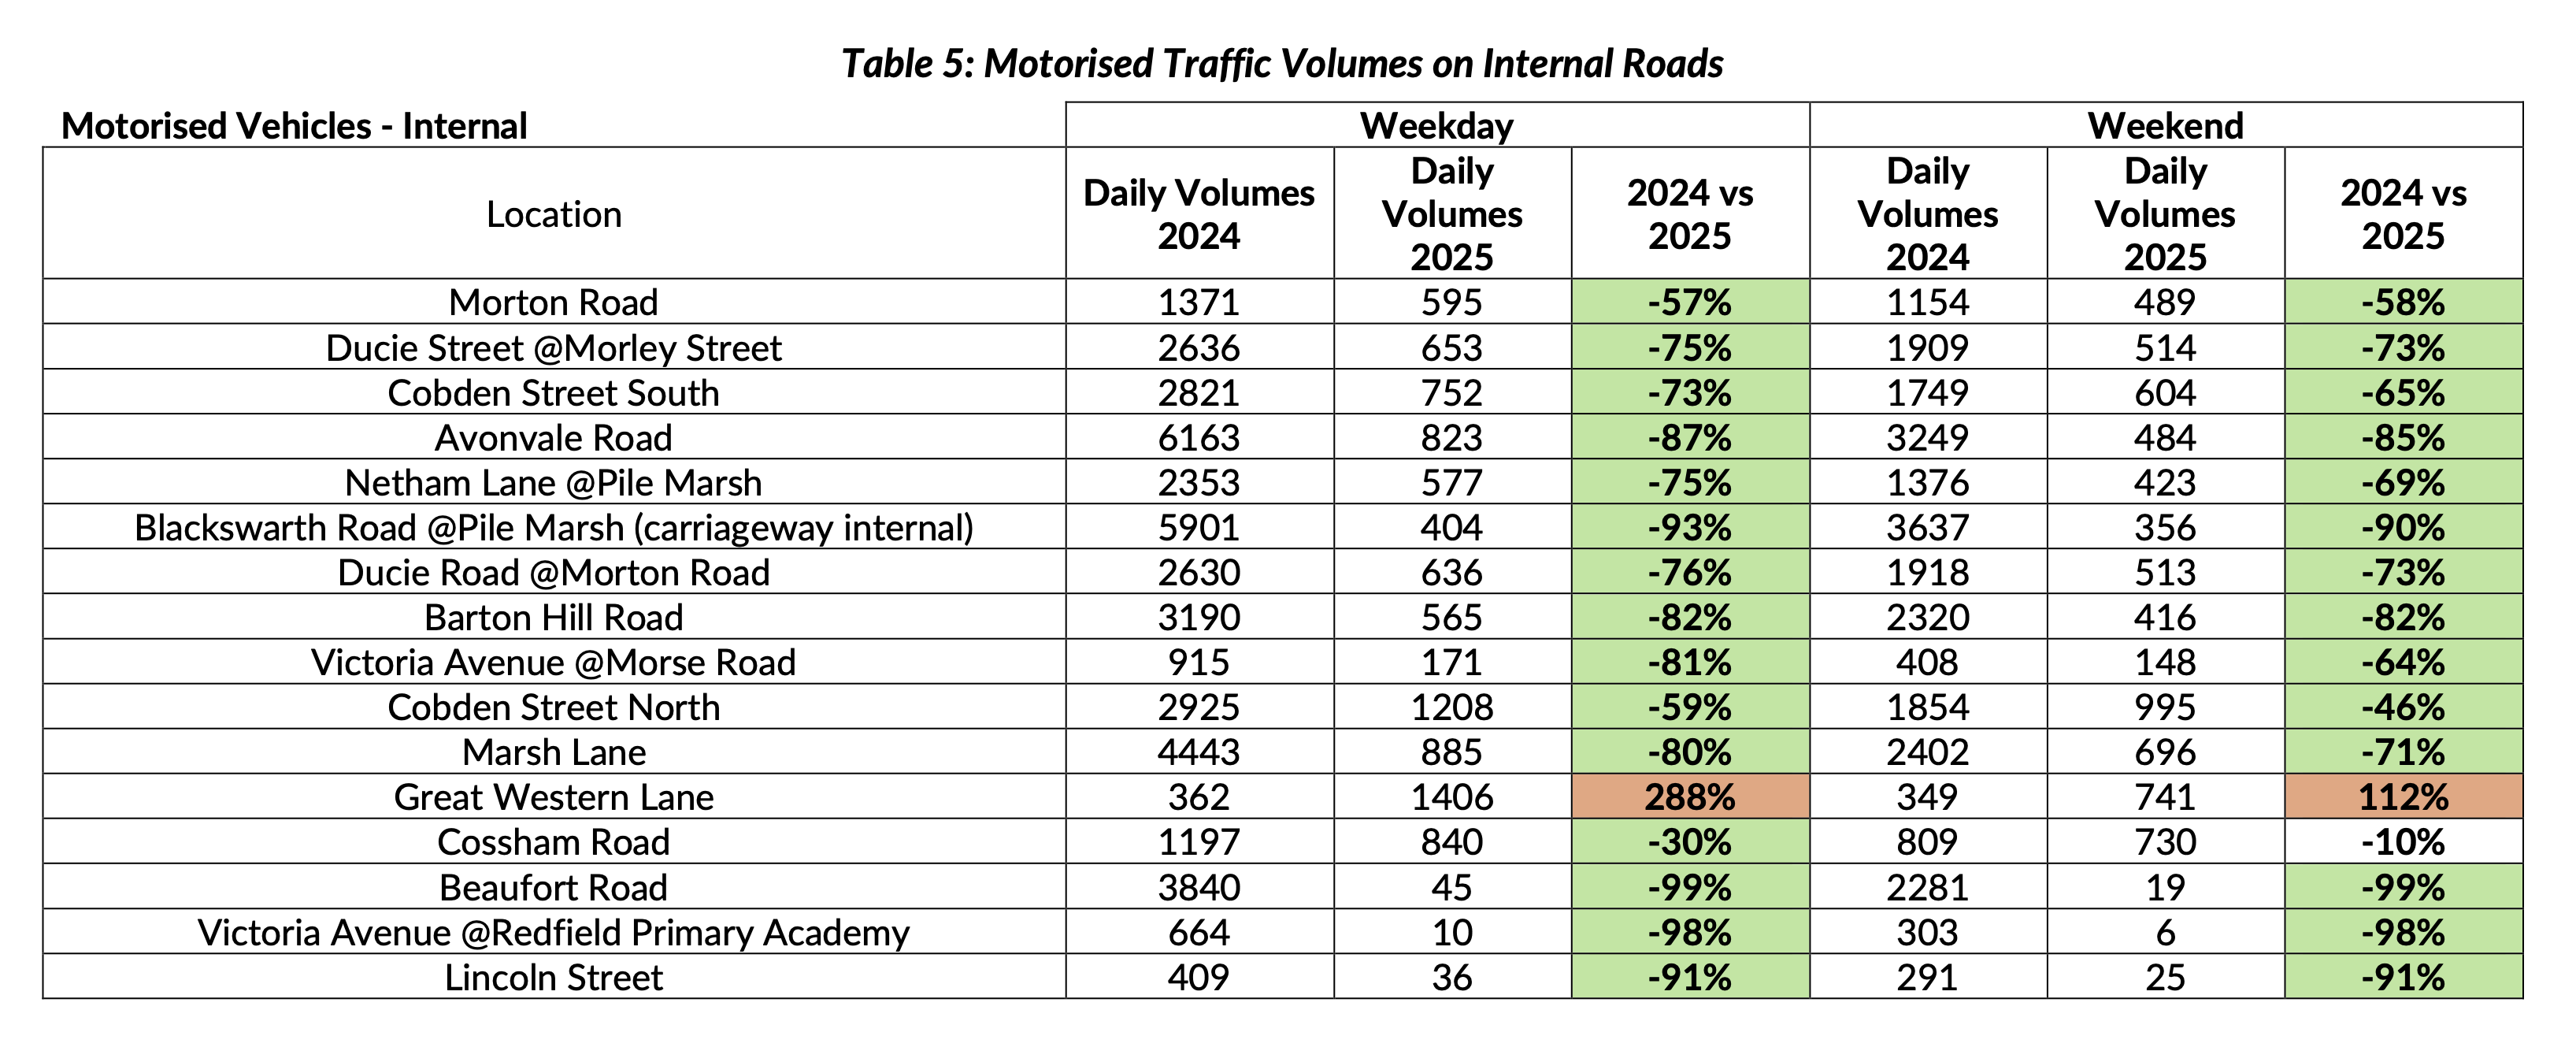
The “77% reduction” quoted in the Full Business Case has been calculated by taking an average of the OTHER 15 roads — excluding the inconvenient Great Western Lane result!
So that is FUNDAMENTALLY DISHONEST, to begin with.
If the 288% increase for Great Western Lane is factored in, then the average “weekday reduction” of these 16 roads was ONLY 54%.
But even if Great Western Lane is ignored, the supposed “77% reduction” only applies to the remaining 15 Internal Roads which were actually MONITORED.
But that is NOT the full picture, throughout the WHOLE AREA…
The Sensor Positions
On page 35 of the Monitoring Report, the VivaCity sensors recorded a 100% reduction in Car Volumes, in Beaufort Road and Victoria Avenue.
But of course they did — because those roads were now blocked by modal filters — and the sensors were placed right next to them!
This is like shooting someone in the head — then taking their pulse — and noting a “100% reduction”!
Obviously there was not a 100% reduction of traffic along the ENTIRE LENGTH of those roads. People still live there — so needed to come and go.
So the result of each SENSOR is NOT REPRESENTATIVE of the full ROAD.
And the SELECTION of roads is NOT REPRESENTATIVE of the full AREA…
The MONITORED Roads
Here is a list of the Internal Roads where traffic volumes were MONITORED — indicating those which had a new traffic restriction in close proximity:
- Avonvale Road - Bus Gate
- Barton Hill Road - Pocket Park
- Beaufort Road - Modal Filter
- Blackswarth Road / Beaufort Road - Modal Filter
- Cobden Street North - Pocket Park
- Cobden Street South - Pocket Park
- Cossham Road - Modal Filter in Wicket Lane
- Ducie Road (x 2) - Modal Filter
- Great Western Lane - no traffic restriction
- Lincoln Street - Modal Filter
- Marsh Lane - Bus Gate
- Morton Road - Modal Filter
- Netham Road - Bus Gate
- Victoria Avenue x 2 - Modal Filters x 2
So, all-but-one of the monitored Internal Roads had a new traffic restriction close to the sensor, and so — surprise surprise! — the RECORDED traffic volume went DOWN.
But at the ONE recorded location WITHOUT a traffic restriction — Great Western Road — the volume WENT UP nearly 300% — due to drivers re-routing, to avoid the Marsh Lane bus gate.
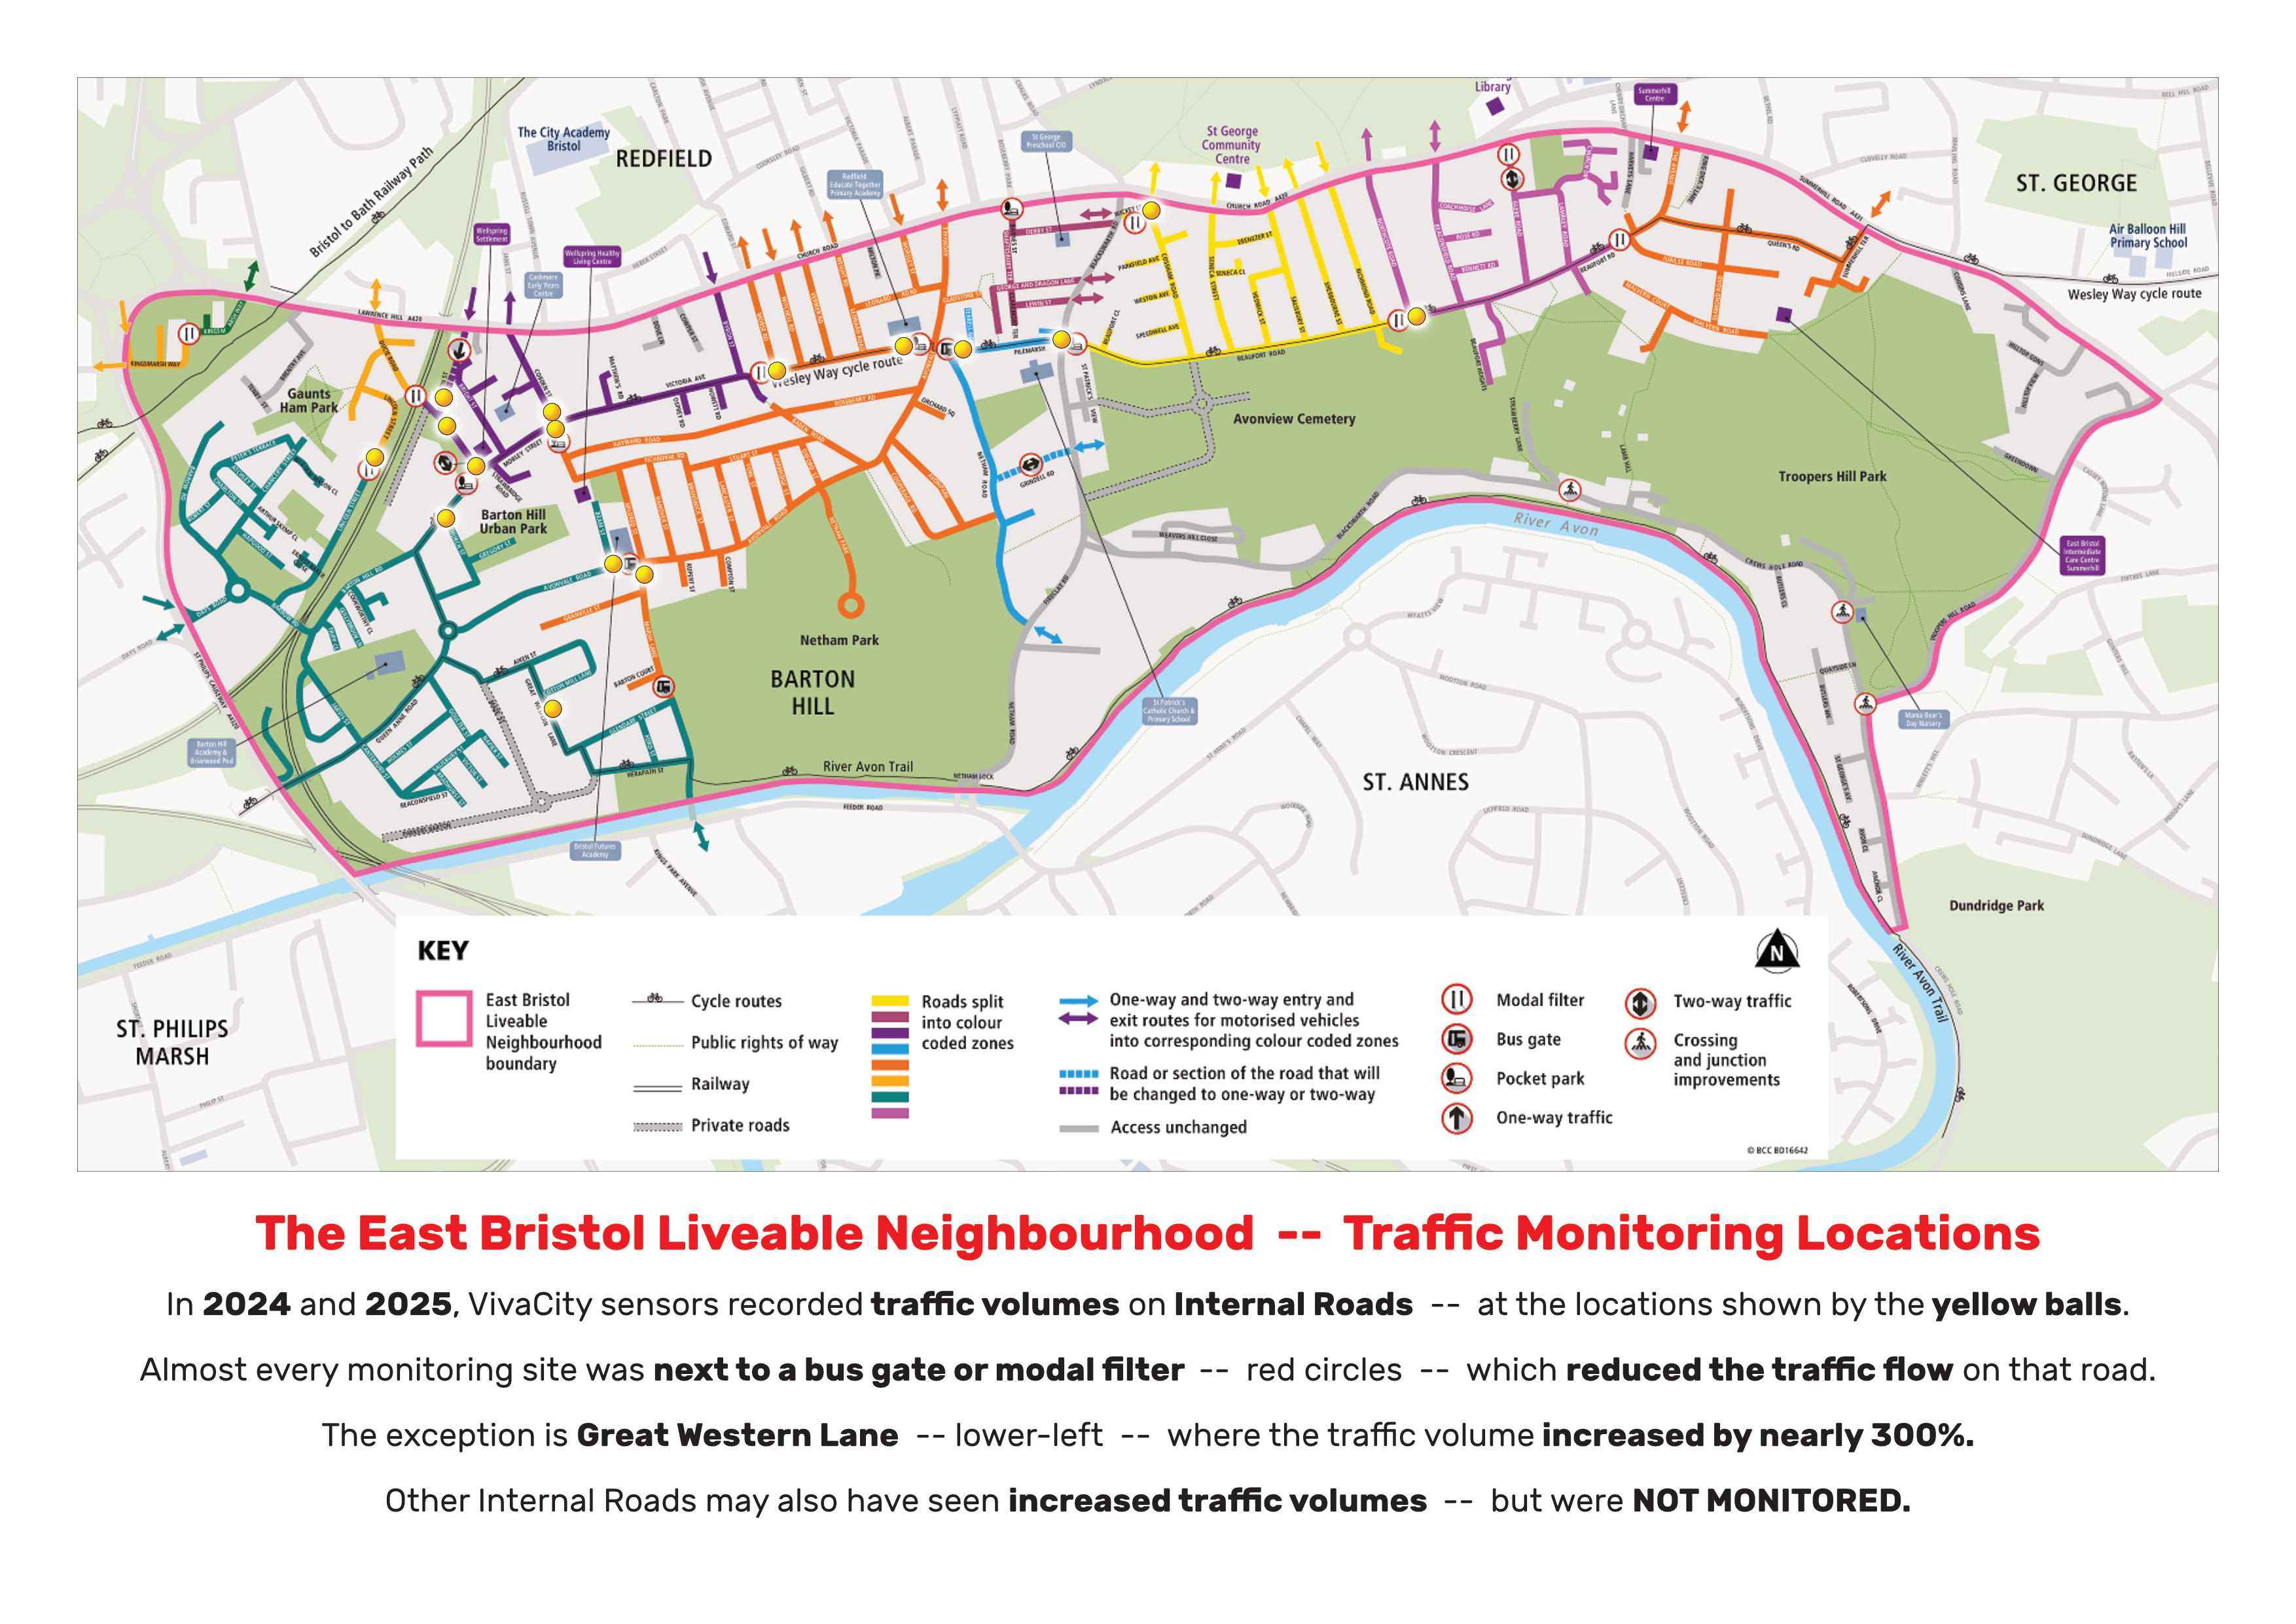
But what about all the OTHER Internal Roads, which were NOT monitored…?
The Roads NOT MONITORED
The following list shows some of the other Internal Roads, which the Council’s EBLN literature told local residents they would now need to use, to access their homes — as shown by the “to and fro” arrows on the Council’s EBLN Map…
- Beaconsfield Road
- Byron Street
- Days Road
- Derby Street
- George and Dragon Lane
- Grindell Road
- Kingsmarsh Way
- Lewin Street
- Morse Road
- Northcote Road
- Richmond Road
- Salisbury Street
- Seneca Street
- Sherbourne Street
- Summerhill Terrace
- The Avenue
- Verrier Road
- Weight Road
- Witchell Road
- Worsley Street
Google Maps indicates that the EBLN area contains 157 Internal Roads.
The ones listed here are just the ones near the perimeter — which the Council told residents to use, instead of their usual routes. So it was reasonable to expect the volume of local traffic using these roads would RISE.
But how many of these roads were actually MONITORED?
That’s right — NONE OF THEM!
Misuse of “Most”
Page 26 of the Full Business Case tells the Committee’s elected councillors:
“Traffic counts
“- There has been a significant decrease in motorised vehicle traffic across most internal roads within the EBLN area.”
WRONG.
The stats show a decrease of traffic at isolated spots close to modal filters — in 15 of the 16 Internal Roads which were actually MONITORED.
That is NOT the same as “MOST INTERNAL ROADS”.
15 is NOT “most” of 157!
It’s less than 10%!
Obviously the Council couldn’t monitor every road. But this wasn’t a representative sample — as all those monitored roads had a traffic restriction near the sensor.
This was the most UNREPRESENTATIVE sample it was possible to select.
And yes — these unrepresentative monitoring sites were SELECTED.
And now their already-distorted results are being FURTHER MISREPRESENTED to the Committee.
Conclusions
The Council CANNOT CLAIM that there has been “a significant decrease in motorised vehicle traffic across most internal roads within the EBLN area”.
The Council has NO IDEA what has happened, on MOST Internal Roads.
Many Internal Roads will have seen significant RISES in traffic volumes — like those at Great Western Lane. But they were simply not recorded.
Because the Council DIDN’T MONITOR them!
The False Data Claim
Returning to Page 25 of the Full Business Case — the “key headline” is stated as:
“Internal roads saw a 77% reduction on weekdays and 72% on weekends.”
It does not claim “most” internal roads.
It does not even claim “most” of the internal roads which were monitored, but excluding Great Western Road…
It simply claims that “Internal roads saw a 77% reduction…”
And that is — provably — NOT TRUE.
More info on how to get involved in keeping Bristol moving can be found here:
Another corker Helen, thank you so much for airing more of BCC's dirty laundry. Will BCC ever admit the true extent of harm and suffering their LTN policy is causing? To inflict such a cruel form of punishment on hard working people just trying to get about their everyday lives. It's a forced misery based on flawed data and paid-for, net zero nonsense science. All of this trickles back to the UN Agenda's 17 sustainable goals if anyone is interested.
Rosa Koire wrote a great book on this very thing and how these UN goals ooze and permeates into every crack of council (local )policy making. Once you see it, you'll see it everywhere!
Ps. Spotify have an audio version of Rosa's 'Behind The Green Mask' book.
Thanks for pointing this out Helen. UN Agenda 2030 that nobody in the UK voted for must go ahead.